[Feedback] FI Planner

Baptiste Wicht

The Poor Swiss
Staff member
Hi,

I am trying to build a new calculator to do some Financial Independence planning. The goal of this is to accurately plan when we can reach FI and whether our plan holds in retirement.

I have reached a decent first version:


I would appreciate any feedback:
* Features to add
* Things that don't work
* How to improve it

Thanks
 
Hi Baptiste.

Cool calculator!

I would suggest including the expected rate of return for the different portfolio options.
For example: 100% stocks (7% annual standard returns)

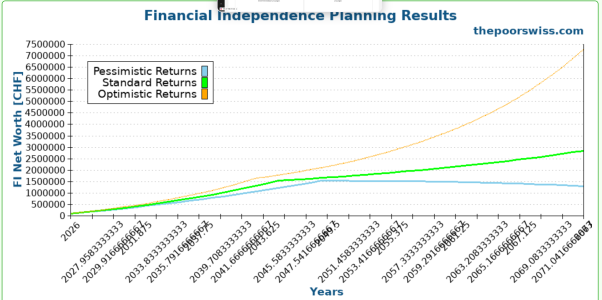
Also, for the graph that displays it may be easier to read if the years are displayed on the x axis as whole years rather than fractional years.
 
Thanks Baptiste! This gives a clear picture and a clear answer to the question if you are ready for FI.

Some comments:
  • Withdrawal Rate. Isn't this the sum of all the other numbers? Or is this, in other words, the annual performance that I exepct of my portfolio? Alternatively, you could link to your article that describes this concept.
  • Annual Income: maybe add 'before retirement'
  • FI Net Worth: I would add a definition for this, or link to your article that describes this concept.
  • Amount of social security: this assumes that you withdraw your 2nd pillar completely, right? So this number is only the first pillar?
  • Maybe add a separate text if you are not able to be FI before retirement age.
  • The two lines 'You need to accumulate 2 500 000,00 to be Financially Independent.' And 'You are not yet financially independent' could be on one line since they are closely connected.
 
Thanks for your feedback @Rebecca !

I would suggest including the expected rate of return for the different portfolio options.
For example: 100% stocks (7% annual standard returns)
Do you mean that the user should be able to configure the rate of return?

I am a bit torn on that because I use the historical data for compute the success rate and then use 3/5/7 for the graphs, it could be better.

Also, for the graph that displays it may be easier to read if the years are displayed on the x axis as whole years rather than fractional years.
Absolutely, I need to fix this.
 
Thanks for your feedback @gaijin

Withdrawal Rate. Isn't this the sum of all the other numbers? Or is this, in other words, the annual performance that I exepct of my portfolio? Alternatively, you could link to your article that describes this concept.
Not really the sum of any other number. Retirement expenses + withdrawal rate can get us the target net worth.

I will add some help points later.
Annual Income: maybe add 'before retirement'
Yes and done (y)
FI Net Worth: I would add a definition for this, or link to your article that describes this concept.
Absolutely, I should make this clearer once I write the details of the page.
Amount of social security: this assumes that you withdraw your 2nd pillar completely, right? So this number is only the first pillar?
Yes, it does. I assume that most FIRE people will have a vested benefits accounts and therefore cannot get a pension.
Maybe add a separate text if you are not able to be FI before retirement age.
Excellent!
The two lines 'You need to accumulate 2 500 000,00 to be Financially Independent.' And 'You are not yet financially independent' could be on one line since they are closely connected.
Good idea (y)
 
I get interesting year roundings :)Would it be possible to change that so that only the full year is visible, with no point and no decimals.
 

Attachments

  • year_roundings.png
    year_roundings.png
    491.1 KB · Views: 1
I have played around with the Portfoliocharts calculator, which allows home country adjustment and delivers partially surprising results:

PortfolioSWR for Switzerland and 35 years of retirement
100% US LCB2,4%
100% CHE LCB3,4%
45% CHE LCB
25% CHE ITT
15% gold
15% commodities
4,5%

They bring me to the question, whether our USD-based calculations are really valid for CHF withdrawal rates... :unsure:
 
Last edited:
They bring me to the question, whether our USD-based calculations are really valid for CHF withdrawal rates... :unsure:
I think they are a proxy for us. Yes, they are not entirely valid and never were, but they are the best we have.
 
I think they are a proxy for us. Yes, they are not entirely valid and never were, but they are the best we have.
Is there any way to implement CHF/USD exchange rates into your calculators? Have you thought of a calculator based on a Swiss index?
 
Is there any way to implement CHF/USD exchange rates into your calculators?
I have implemented this in my advanced FIRE calculator


The problem is that this severely limits the historical range.
Also, this includes events like the end of the gold standard and the end of the Bretton Woods system. I don't think this is really representative of what could happen in the future.
Have you thought of a calculator based on a Swiss index?
On the advanced one, I have support for Swiss bonds and stocks.
 
  • Like
Reactions: Max
The improvement of SWR for a diversified portfolio is smaller than with Portfoliocharts, but still significant.

PortfolioSWR (2M, US, USD, 95% SR, 35 years, 20000 pension p.a. in 14 years)
100% US stocks4.2
45% US stocks
25% US bonds
15% gold
15% commodities
4.7 (4.8 with yearly rebalancing)
 
Last edited:
Do you mean that the user should be able to configure the rate of return?

I am a bit torn on that because I use the historical data for compute the success rate and then use 3/5/7 for the graphs, it could be better.
If you are using historical data then probably the users should not be allowed to change the rate of return. It may be helpful to define the rates of return in the legend. For example: 7% Optimized Returns. And to see how the rate of returns changes with the different portfolio compositions.
 
If you are using historical data then probably the users should not be allowed to change the rate of return. It may be helpful to define the rates of return in the legend. For example: 7% Optimized Returns. And to see how the rate of returns changes with the different portfolio compositions.
Good point, I will show the percentages on the graph and make them vary per portfolio.
 
I have made the percentages vary per portfolio.

I am not entirely convinced about the numbers yet. I am using the 20-year CAGR to the portfolio. I am using the 30th percentile as pessimistic, the 50th (median) as standard, and the 70th percentile as optimistic. Additionally, I am applying an 80% factor on the returns to account for lower returns in Switzerland.
 
I am wondering if adding some support for planning some future expenses could be useful, like paying for solar panels in 2026, buying a car in 2029 or buying a house in 2040.
 
Hi Baptiste. Perhaps this is an item for a more advanced version.

Would it be possible to divide the "FI Net Worth" into two major buckets?
  1. Brokerage Account - This could could still use the "Portfolio" assumptions.
  2. Second Pillar Pension - This could be set manually to whatever average pathetic rate the user has for their second pillar account. The default rate could be the average Swiss second pillar performance rate. Then optionally the users could transfer their second pillar account in x years to a vested benefits account when they retire early. The vested benefits account could be set to a specified portfolio composition and the return rates accordingly adjusted after the x years.
I know this would add significantly more complexity to the tool. I personally would be quite interested in this feature though because then I could have a more comprehensive projection of my total assets.
 
That's an interesting idea indeed.

It's true that the projections are not ideal currently since we cannot expect the pension fund amounts to rise as quickly as others.

I will keep this in mind for a second phase, I'd rather have a first version ready before I move to more complex additions.
 
I am working on the second phase of the calculator. You can access the beta here:


It will include what @Rebecca was suggesting with different buckets. For now, it's not yet being transferred to vested benefits, but it will happen eventually.

One question: Do you think it would be better to use the second pillar contributions by law (percentages by age group) or let people enter the exact contribution of their company? By law, is easier for people but less precise because companies may have differences.

I am also planning a way to save and import the data of the planner (to your computer, not to me!) so that we don't have to start from scratch.
 
Back
Top