I've started investing with IBKR a few days ago, so I'm still learning their UI and how things work.
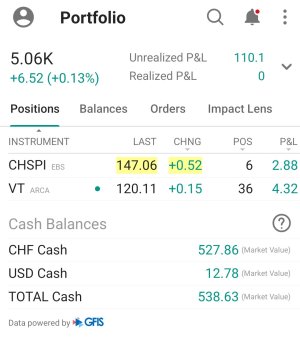
Right now, I struggle to understand some conflicting indicators. I have bought all the listed shares in the screenshot a week ago and not done any trade since then.
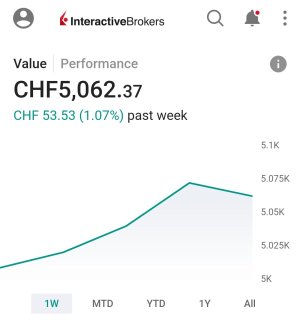
On the chart on the homepage, I can see that I had more yesterday than today, even though the daily P&L is positive and not sure to understand how :


While writing this message and double checking, I may have realized that these kind of fluctuation may happen as the USD/CHF rate changes everyday. Yesterday was the USD slightly higher, which may reflect a higher amount in CHF in the summary. Do I understand it right or is there something else i forget?
Right now, I struggle to understand some conflicting indicators. I have bought all the listed shares in the screenshot a week ago and not done any trade since then.
On the chart on the homepage, I can see that I had more yesterday than today, even though the daily P&L is positive and not sure to understand how :


While writing this message and double checking, I may have realized that these kind of fluctuation may happen as the USD/CHF rate changes everyday. Yesterday was the USD slightly higher, which may reflect a higher amount in CHF in the summary. Do I understand it right or is there something else i forget?
